Ultimate Guide to Support and Resistance
Table of Interests
Looking for the best article on Support and Resistance?, then “Ultimate Guide to Support and Resistance”, is for you.
The concepts of support and resistance are some of the most fundamental topics related to the technical analysis of financial markets. They apply to essentially any market, whether that’s stocks, forex, gold, or cryptocurrencies.
While they’re simple concepts to understand, they’re actually quite difficult to master. Identifying them can be entirely subjective, they’ll work differently in changing market conditions, and you’ll need to understand their different types. But above all, you’ll need to study a lot of charts, and this guide will help you get started.
What are support and resistance?
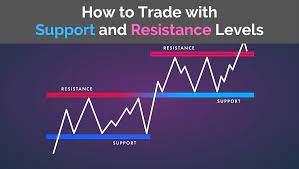
On the most fundamental level, support and resistance are simple concepts. The price finds a level that it’s unable to break through, with this level acting as a barrier of some sort. In the case of support, price finds a “floor,” while in the case of resistance, it finds a “ceiling.” Basically, you could think of support as a zone of demand and resistance as a zone of supply.
While more traditionally, support and resistance are indicated as lines, the real-world cases are usually not as precise. Bear in mind; the markets aren’t driven by some physical law that prevents them from breaching a specific level. This is why it may be more beneficial to think of support and resistance as areas. You can think of these areas as ranges on a price chart that will likely drive increased activity from traders.
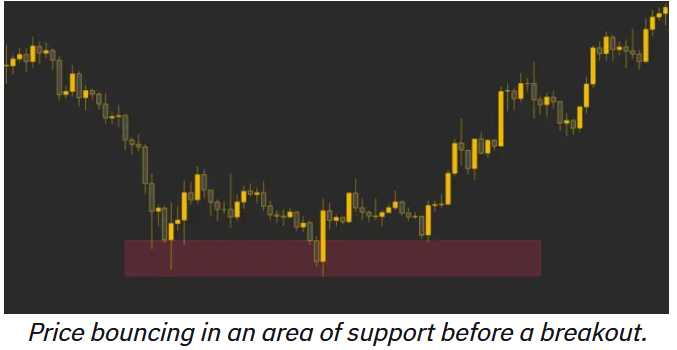
Let’s look at an example of a support level. Note that the price continually entered an area where the asset was bought up. A support range was formed as the area was retested multiple times. And since the bears (sellers) were unable to push the price further down, it eventually bounced – potentially starting a new uptrend.
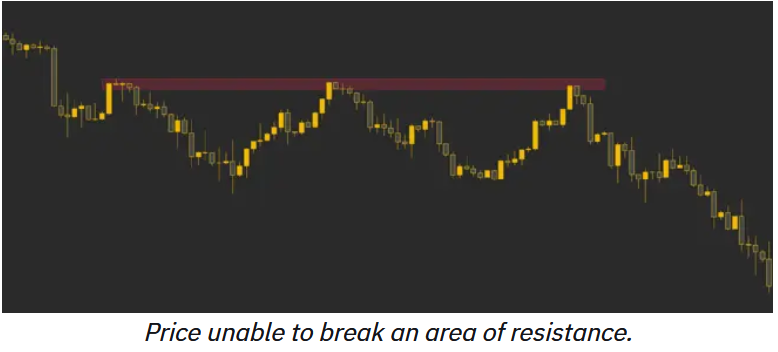
Now let’s look at a resistance level. As we can see, the price was in a downtrend. But after each bounce, it failed to break through the same area multiple times. The resistance level is formed because the bulls (buyers) were unable to gain control of the market and drive the price higher, causing the downtrend to continue.
How traders can use support and resistance levels
Technical analysts use support and resistance levels to identify areas of interest on a price chart. These are the levels where the likelihood of a reversal or a pause in the underlying trend may be higher.
Market psychology plays a huge part in the formation of support and resistance levels. Traders and investors will remember the price levels that previously saw increased interest and trading activity. Since many traders may be looking at the same levels, these areas might bring increased liquidity. This often makes the support and resistance zones ideal for large traders (or whales) to enter or exit positions.
Support and resistance are key concepts when it comes to exercising proper risk management. The ability to consistently identify these zones can present favorable trading opportunities. Typically, two things can happen once the price reaches an area of support or resistance. It either bounces away from the area or breaks through it and continues in the direction of the trend – potentially to the next support or resistance area.
Entering a trade near a level of support or resistance area may be a beneficial strategy. Mainly because of the relatively close invalidation point – where we usually place a stop-loss order. If the area is breached and the trade is invalidated, traders can cut their loss and exit with a small loss. In this sense, the further the entry is from the zone of supply or demand, the further the invalidation point is.
Something else to consider is how these levels may react to changing context. As a general rule, a broken area of support may turn into an area of resistance when broken. Conversely, if an area of resistance is broken, it may turn into a support level later, when it’s retested. These patterns are sometimes called a support-resistance flip.
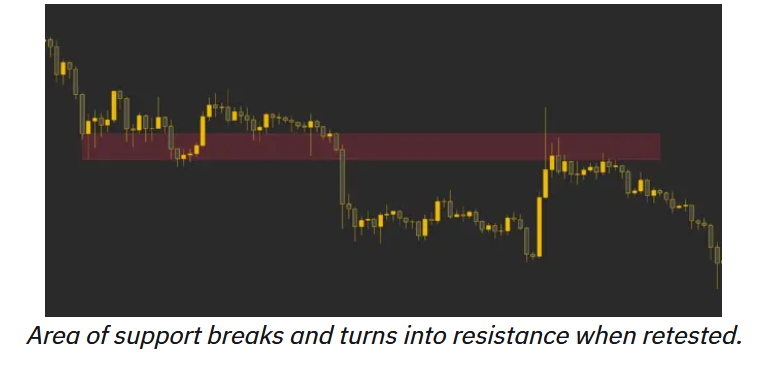
Area of support breaks and turns into resistance when retested.
The fact that the previous support zone acts as resistance now (or vice versa) confirms the pattern. As such, the retest of the area may be a favorable place to enter a position.
Another thing to consider is the strength of a support or resistance area. Typically, the more times the price drops and retests a support area, the more likely it is to break to the downside. Similarly, the more times the price increases and retests a resistance area, the more likely it is to break to the upside.
So, we’ve gone through how support and resistance works when it comes to price action. But what other types of support and resistance are out there? Let’s go over a few of them.
Psychological support and resistance
The first type we’ll discuss is called psychological support and resistance. These areas don’t necessarily correlate with any technical pattern but exist because of how the human mind tries to make sense of the world.
In case you haven’t noticed, we live in a staggeringly complex place. As such, we inadvertently try to simplify the world around us so we can make more sense of it – and this includes rounding numbers up. Have you ever thought to yourself that you have a craving for 0.7648 of an apple? Or asked a merchant for 13,678,254 grains of rice?
A similar effect is at play in the financial markets. It’s especially true for cryptocurrency trading, which involves easily divisible digital units. Buying an asset at $8.0674 and selling it at $9.9765 just isn’t processed the same as buying it at $8 and selling at $10. This is why round numbers can also act as support or resistance on a price chart.
Well, if only it’d be that simple! This phenomenon has become well-known over the years. As such, some traders might try to “frontrun” obvious psychological support or resistance areas. Frontrunning, in this case, means placing orders just above or below an anticipated support or resistance area.
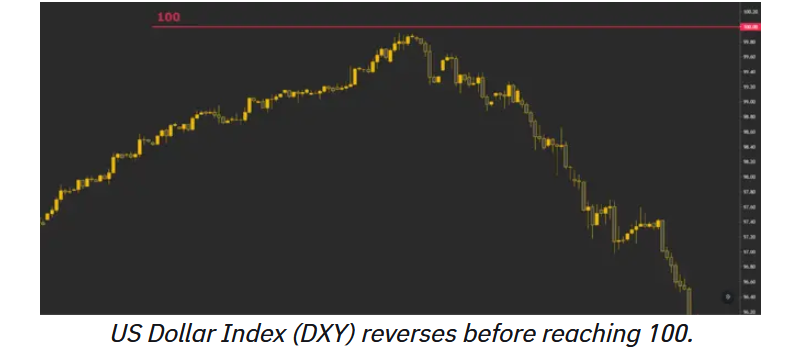
Take a look at the example below. As the DXY approaches 100, some traders place sell orders just below that level to make sure those orders are filled. Because so many traders expect a reversal at 100 and many frontrun the level, the market never reaches it and reverses just before.
Trend line support and resistance
If you’ve read our classical chart patterns article, you’ll know that patterns will also act as barriers for price. In the example below, an ascending triangle keeps the price contained until the pattern breaks to the upside.
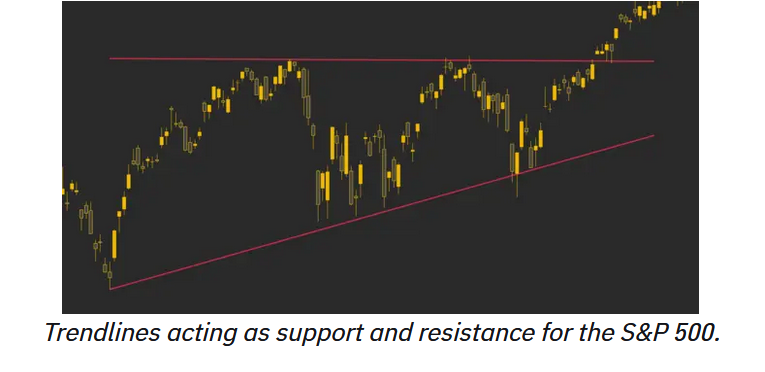
You can use these patterns to your advantage and identify areas of support and resistance that coincide with trend lines. They can be especially useful if you manage to spot them early, before the pattern is fully developed.
Moving average support and resistance
Many indicators may also provide support or resistance when they interact with the price.
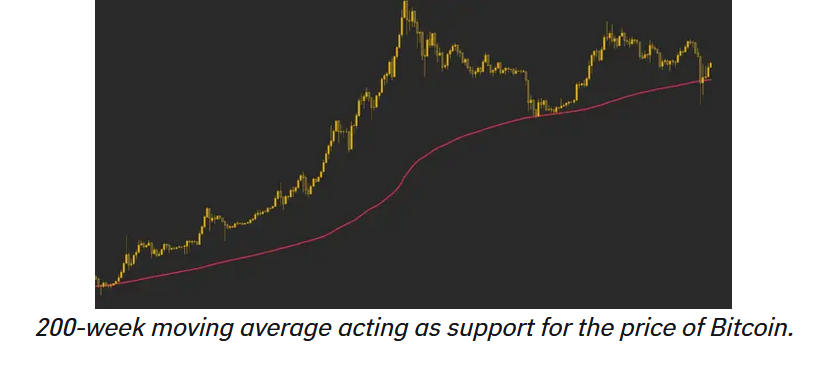
One of the most straightforward examples of this are moving averages. As a moving average acts as support or resistance for the price, many traders use it as a barometer for the overall health of the market. Moving averages may also be useful when trying to spot trend reversals or pivot points.
Looking to get started with cryptocurrency? Buy Bitcoin on Binance!
Fibonacci support and resistance
Levels outlined by the Fibonacci retracement tool may also act as support and resistance.
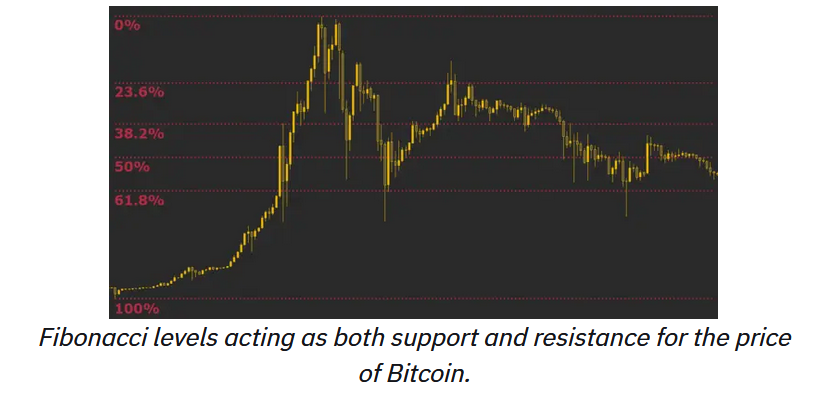
In our example below, the 61.8% Fibonacci level acts as support multiple times, while the 23.6% level acts as resistance.
What is confluence in technical analysis?
So far, we’ve discussed what support and resistance are, and some of their different types. But what’s the most effective way to build trading strategies around them?
A key thing to understand is a concept called confluence. Confluence is when a combination of multiple strategies are used together to create one strategy. Support and resistance levels tend to be the strongest when they fall into multiple of these categories that we’ve discussed.
Let’s consider this through two examples. Which potential support zone do you think has a higher chance to actually act as support?
Support 1 coincides with:
- a previous resistance area
- an important moving average
- a 61.8% Fibonacci level
- a round number in the price
Support 2 coincides with:
- a previous resistance area
- a round number in the price
If you’ve been paying attention, you’ll correctly guess that Support 1 has a higher chance of holding the price. While this may be true, the price could also fly through it. The point here is that the probability of it acting as support is higher than it is for Support 2. With that said, there are no guarantees when it comes to trading. While trading patterns can be helpful, past performance does not imply future performance, so you should be prepared for all possible outcomes.
Historically, the setups that are confirmed by multiple strategies and indicators tend to provide the best opportunities. Some successful confluence traders might be very picky about what setups they enter – and it often involves a lot of waiting. However, when they do enter trades, their setups tend to work out with a high probability.
Even so, it’s always essential to manage risk and protect your capital from unfavorable price movements. Even the strongest looking setups with the best entry points have a chance of going the other way. It’s important to consider the possibility of multiple scenarios, so you don’t fall into false breakouts or bull and bear traps.
Closing thoughts
Regardless if you’re day trading or swing trading, support and resistance are fundamental concepts to understand when it comes to technical analysis. Support acts as a floor for price, while resistance acts as a ceiling.
Different forms of support and resistance can exist, and some are based on the interaction of price with technical indicators. The most reliable support and resistance areas tend to be the ones that are confirmed by multiple strategies.
That’s the much we can take on the topic “Ultimate Guide to Support and Resistance“.
Thanks For Reading
Common Cryptocurrency Scams on Mobile Devices
Ultimate Guide to Symmetric versus Asymmetric Encryption
How Blockchain Is Used in The Internet of Things (IoT)
Ultimate Guide to Understanding What Makes a Blockchain Secure
Upto Date Blockchain Use Cases
Initial Coin Offering List – Comprehensive List of Projects Currently Doing ICO
Ultimate Guide to Initial Coin Offering (ICO)
Ultimate Guide to Understanding What Fractional Reserve is
Understanding Why Public WiFi Is Insecure
The Ultimate History of Cryptography
Understanding what DoS Attack is
Ultimate Guide to what Fiat Currency is
Ultimate Guide to zk-SNARKs and zk-STARKs
Things to Avoid When Using Binance Chain
How Blockchain Is Used In Charity
How Blockchain is Used in Supply Chain
Ultimate Guide to What a Replay Attack is
Ultimate Guide to Delegated Proof of Stake
Ultimate Guide to what Ransomware is
Ultimate Guide to understanding Cryptojacking
Ultimate Guide to Understanding Inflation for Beginners
How to Know Cryptocurrencies Pyramid and Ponzi Schemes
Ultimate Beginner’s Guide to Bitcoin’s Lightning Network
Advantages and Disadvantages Of Blockchain
Ultimate Guide to Ethereum Plasma
Leave a Reply