Moving Averages in Crypto For Beginners
Table of Interests
Looking for what Moving averages are? then “Moving Averages in Crypto For Beginners” is for you.
Although there are different variations of moving averages, their underlying purpose is to drive clarity in trading charts. This is done by smoothing out the graphs to create an easily decipherable trend indicator. Because these moving averages rely on past data, they are considered to be lagging or trend following indicators. Regardless, they still have great power to cut through the noise and help determine where a market may be heading.
Different types of moving averages
There are various different types of moving averages that can be utilized by traders not only in day trading and swing trading but also in longer-term setups. Despite the various types, the MAs are most commonly broken down into two separate categories: simple moving averages (SMA) and exponential moving averages (EMA). Depending on the market and desired outcome, traders can choose which indicator will most likely benefit their setup.
The simple moving average
The SMA takes data from a set period of time and produces the average price of that security for the data set. The difference between an SMA and a basic average of the past prices is that with SMA, as soon as a new data set is entered, the oldest data set is disregarded. So if the simple moving average calculates the mean based on 10 days worth of data, the entire data set is constantly being updated to only include the last 10 days.
It’s important to note that all data inputs in an SMA are weighted equally, regardless of how recently they were inputted. Traders who believe that there’s more relevance to the newest data available often state that the equal weighting of the SMA is detrimental to the technical analysis. The exponential moving average (EMA) was created to address this problem.
The exponential moving average
EMAs are similar to SMAs in that they provide technical analysis based on past price fluctuations. However, the equation is a bit more complicated because an EMA assigns more weight and value to the most recent price inputs. Although both averages have value and are widely used, the EMA is more responsive to sudden price fluctuations and reversals.
Because EMAs are more likely to project price reversals faster than SMAs, they are often especially favored by traders who are engaged in short-term trading. It is important for a trader or investor to choose the type of moving average according to his personal strategies and goals, adjusting the settings accordingly.
How to use moving averages
Because MAs utilize past prices instead of current prices, they have a certain period of lag. The more expansive the data set is, the larger the lag will be. For example, a moving average that analyzes the past 100 days will respond more slowly to new information than an MA that only considers the past 10 days. That’s simply because a new entry into a larger dataset will have a smaller effect on the overall numbers.
Both can be advantageous depending on the trading setup. Larger data sets benefit long-term investors because they are less likely to be greatly altered due to one or two large fluctuations. Short-term traders often favor a smaller data set that allows for more reactionary trading.
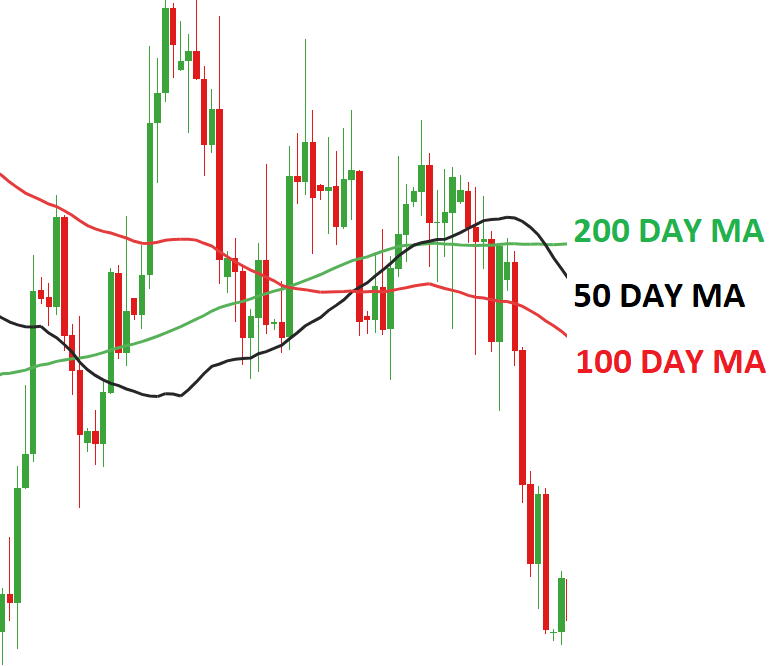
Within traditional markets, MAs of 50, 100 and 200 days are the most commonly used. The 50-day and the 200-day moving averages are closely watched by stock traders and any breaks above or below these lines are usually regarded as important trading signals, especially when they are followed by crossovers. The same applies to cryptocurrency trading but due to its 24/7 volatile markets, the MA settings and trading strategy may vary according to the trader profile.
Crossover signals
Naturally, a rising MA suggests an upward trend and a falling MA indicates a downtrend. However, a moving average alone is not a really reliable and strong indicator. Therefore, MAs are constantly used in combination to spot bullish and bearish crossover signals.
A crossover signal is created when two different MAs crossover in a chart. A bullish crossover (also known as a golden cross) happens when the short-term MA crosses above a long-term one, suggesting the start of an upward trend. In contrast, a bearish crossover (or death cross) happens when a short-term MA crosses below a long-term moving average, which indicates the beginning of a downtrend.
Other factors worth considering
The examples so far have all been in terms of days, but that’s not a necessary requirement when analyzing MAs. Those engaged in day trading may be much more interested in how an asset has performed over the past two or three hours, not two or three months. Different time frames can all be plugged into the equations used to calculate moving averages, and as long as those time frames are consistent with the trading strategy, the data can be useful.
One major downside of MAs is their lag time. Since MAs are lagging indicators that consider previous price action, the signals are often too late. For instance, a bullish crossover may suggest a buy, but it may only happen after a significant rise in price.
This means that even if the uptrend continues, potential profit may have been lost in that period between the rise in price and the crossover signal. Or even worse, a false golden cross signal may lead a trader to buy the local top just before a price drop. These fake buy signals are usually referred to as a bull trap.
Closing thoughts
Moving Averages are powerful TA indicators and one of the most widely used. The ability to analyze market trends in a data-driven manner provides great insight into how a market is performing. Keep in mind, however, that MAs and crossover signals should not be used alone and it is always safer to combine different TA indicators in order to avoid fake signals
Common Cryptocurrency Scams on Mobile Devices
Ultimate Guide to Symmetric versus Asymmetric Encryption
How Blockchain Is Used in The Internet of Things (IoT)
Ultimate Guide to Understanding What Makes a Blockchain Secure
Upto Date Blockchain Use Cases
Initial Coin Offering List – Comprehensive List of Projects Currently Doing ICO
Ultimate Guide to Initial Coin Offering (ICO)
Ultimate Guide to Understanding What Fractional Reserve is
Understanding Why Public WiFi Is Insecure
The Ultimate History of Cryptography
Understanding what DoS Attack is
Ultimate Guide to what Fiat Currency is
Ultimate Guide to zk-SNARKs and zk-STARKs
Things to Avoid When Using Binance Chain
How Blockchain Is Used In Charity
How Blockchain is Used in Supply Chain
Ultimate Guide to What a Replay Attack is
Ultimate Guide to Delegated Proof of Stake
Ultimate Guide to what Ransomware is
Ultimate Guide to understanding Cryptojacking
Ultimate Guide to Understanding Inflation for Beginners
How to Know Cryptocurrencies Pyramid and Ponzi Schemes
Ultimate Beginner’s Guide to Bitcoin’s Lightning Network
Advantages and Disadvantages Of Blockchain
Ultimate Guide to Ethereum Plasma
Leave a Reply