12 Top Popular Candlestick Patterns Used in Technical Analysis
Table of Interests
Looking for the best article on Candle Sticks?, then “12 Top Popular Candlestick Patterns Used in Technical Analysis 2021”, is for you.
Candlestick charts are one of the most commonly used technical tools to analyze price patterns. They have been used by traders and investors for centuries to find patterns that may indicate where the price is headed. This article will cover some of the most well-known candlestick patterns with illustrated examples.
If you’d first like to get familiar with reading candlestick charts, check out A Beginner’s Guide to Candlestick Charts.
How to use candlestick patterns
There are countless candlestick patterns that traders can use to identify areas of interest on a chart. These can be used for day trading, swing trading, and even longer-term position trading. While some candlestick patterns may provide insights into the balance between buyers and sellers, others may indicate a reversal, continuation, or indecision.
It’s important to note that candlestick patterns aren’t necessarily a buy or sell signal by themselves. They are instead a way to look at market structure and a potential indication of an upcoming opportunity. As such, it is always useful to look at patterns in context. This can be the context of the technical pattern on the chart, but also the broader market environment and other factors.
In short, like any other market analysis tool, candlestick patterns are most useful when used in combination with other techniques. These may include the Wyckoff Method, the Elliott Wave Theory and the Dow Theory. It can also include technical analysis (TA) indicators, such as Trend Lines, Moving Averages, the Relative Strength Index (RSI), Stochastic RSI, Bollinger Bands, Ichimoku Clouds, Parabolic SAR, or the MACD.
Bullish reversal patterns
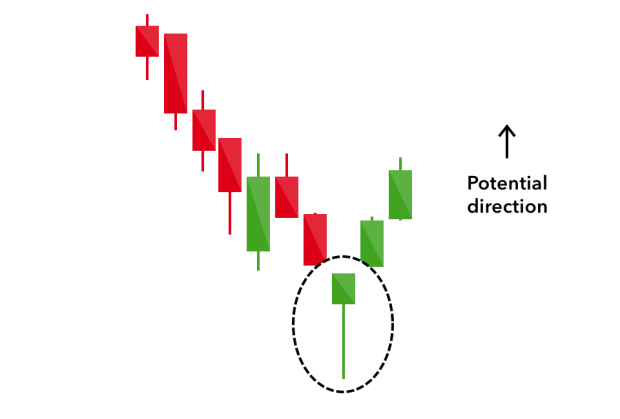
Hammer
A candlestick with a long lower wick at the bottom of a downtrend, where the lower wick is at least twice the size of the body.
A hammer shows that even though the selling pressure was high, the bulls drove the price back up close to the open. A hammer can be either red or green, but green hammers may indicate a stronger bull reaction.
Inverted hammer
Also called the inverse hammer, it’s just like a hammer, but with a long wick above the body rather than below. Similar to a hammer, the upper wick should be at least twice the size of the body.
An inverted hammer occurs at the bottom of a downtrend and may indicate a potential reversal upward. The upper wick shows that price stopped its continued downward movement, even though the sellers eventually managed to drive it down near the open. As such, the inverted hammer may suggest that buyers soon might gain control of the market.
Three white soldiers
The three white soldiers pattern consists of three consecutive green candlesticks that all open within the previous candle’s body, and close at a level exceeding the previous candle’s high.
Ideally, these candlesticks shouldn’t have long lower wicks, indicating that continuous buying pressure is driving the price up. The size of the candles and the length of the wicks can be used to judge the chances of continuation or a possible retracement.
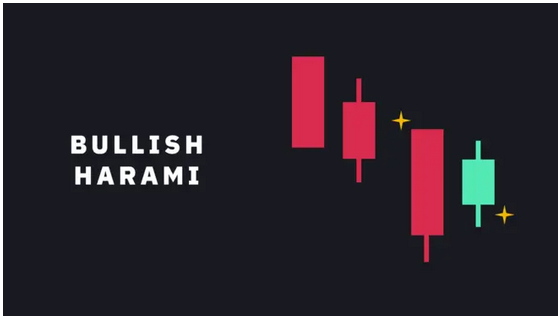
Bullish harami
A bullish harami is a long red candle followed by a smaller green candle that’s entirely contained within the body of the previous candle.
The bullish harami can unfold over two or more days, and it’s a pattern indicating that selling momentum is slowing down and might be coming to an end.
Bearish reversal patterns
Hanging man
The hanging man is the bearish equivalent of a hammer. It typically forms at the end of an uptrend with a small body and a long lower wick.
The lower wick indicates that there was a large sell-off, but bulls managed to take back control and drive the price up. Keeping that in mind, after a prolonged uptrend, the sell-off may act as a warning that the bulls might soon be losing control of the market.
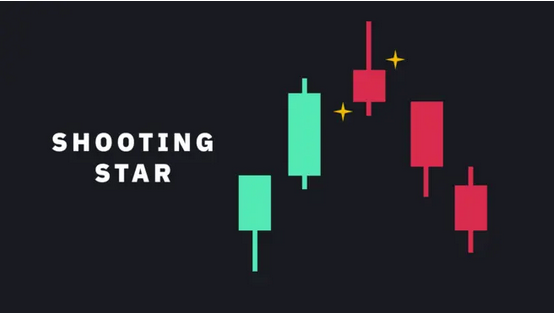
Shooting star
The shooting star is made of a candlestick with a long upper wick, little or no lower wick, and a small body, ideally near the low. The shooting star is a similar shape as the inverted hammer but is formed at the end of an uptrend.
It indicates that the market reached a high, but then sellers took control and drove the price back down. Some traders prefer to wait for the next few candlesticks to unfold for confirmation of the pattern.
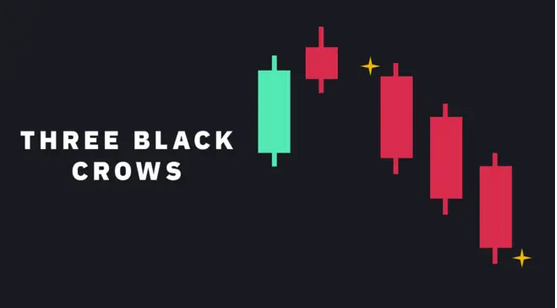
Three black crows
The three black crows are made of three consecutive red candlesticks that open within the previous candle’s body, and close at a level below the previous candle’s low.
The bearish equivalent of three white soldiers. Ideally, these candlesticks shouldn’t have long higher wicks, indicating continuous selling pressure driving the price down. The size of the candles and the length of the wicks can be used to judge the chances of continuation.
Bearish harami
The bearish harami is a long green candle followed by a small red candle with a body that’s entirely contained within the body of the previous candle.
The bearish harami can unfold over two or more days, appears at the end of a downtrend, and may indicate that buying pressure is decreasing.
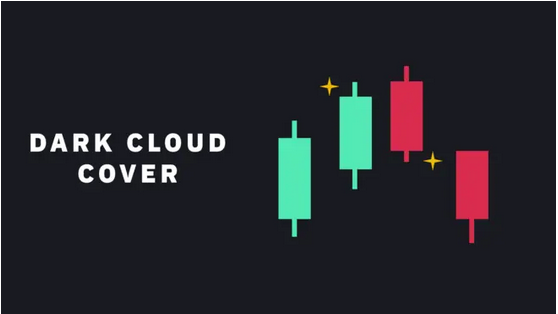
Dark cloud cover
The dark cloud cover pattern consists of a red candle that opens above the close of the previous green candle but then closes below the midpoint of that candle.
It can often be accompanied by high volume, indicating that momentum might be shifting from the upside to the downside. Traders might wait for a third red candle for confirmation of the pattern.
Continuation patterns
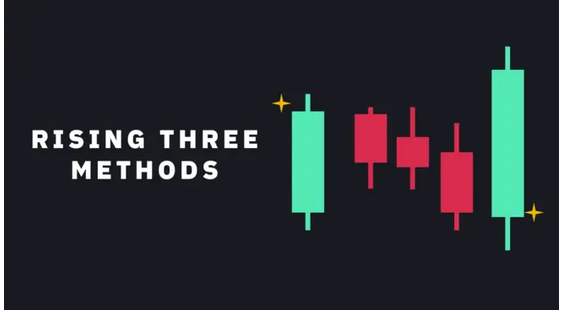
Rising three methods
This pattern occurs in an uptrend, where three consecutive red candles with small bodies are followed by the continuation of the uptrend. Ideally, the red candles shouldn’t breach the range of the preceding candlestick.
The continuation is confirmed with a green candle with a large body, indicating that bulls are back in control of the trend’s direction.
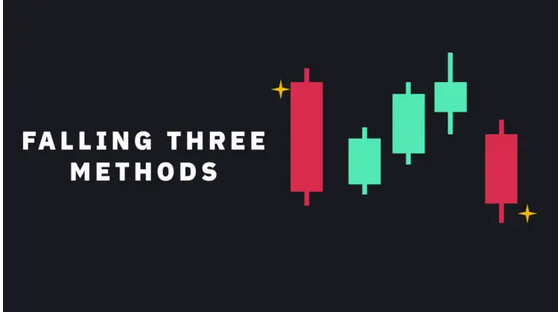
Falling three methods
The inverse of rising three methods, indicating the continuation of a downtrend instead.
Candlestick Patterns Used in Technical Analysis
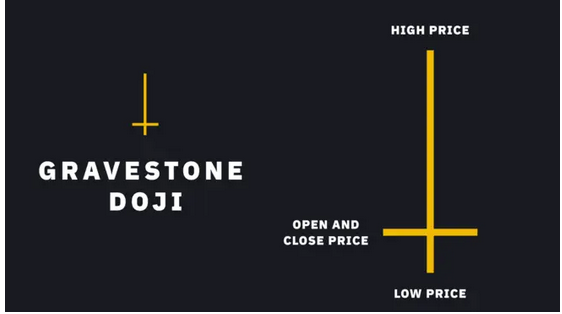
Doji
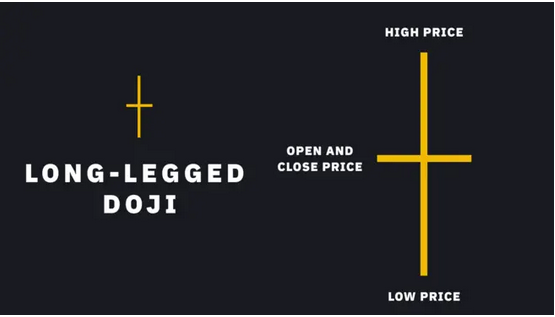
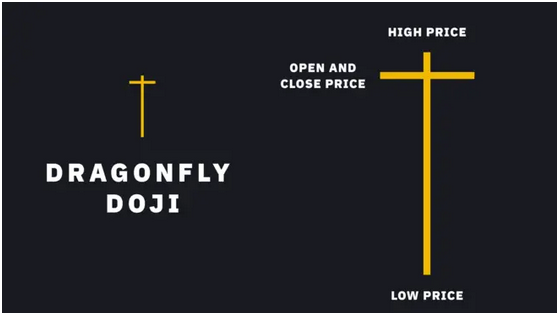
A Doji forms when the open and the close are the same (or very close to each other). The price can move above and below the open but eventually closes at or near the open. As such, a Doji may indicate an indecision point between buying and selling forces. Still, the interpretation of a Doji is highly dependent on context.
Depending on where the line of the open/close falls, a Doji can be described as:
Gravestone Doji – Bearish reversal candle with a long upper wick and the open/close near the low.
Long-legged Doji – Indecisive candle with both a lower and upper wick, and the open/close near the midpoint.
Dragonfly Doji – Either bullish or bearish candle (depending on context) with a long lower wick and the open/close near the high.
According to the original definition of the Doji, the open and close should be exactly the same. But, what if the open and close aren’t the same but are instead very close to each other? That’s called a spinning top. However, since cryptocurrency markets can be very volatile, an exact Doji is rare. As such, the spinning top is often used interchangeably with the Doji.
Candlestick patterns based on price gaps
There are many candlestick patterns that use price gaps. A price gap is formed when a financial asset opens above or below its previous closing price, which creates a gap between the two candlesticks. Since cryptocurrency markets trade round the clock, patterns based on these types of price gaps are not present. Even so, price gaps can still occur in illiquid markets. However, since they happen mainly because of low liquidity and high bid-ask spreads, they might not be useful as actionable patterns.
Closing thoughts
Candlestick patterns are essential for any trader to at least be familiar with, even if they don’t directly incorporate them into their trading strategy.
While they can be undoubtedly useful to analyze the markets, it’s important to remember that they aren’t based on any scientific principles or laws. They instead convey and visualize the buying and selling forces that ultimately drive the markets.
That’s the much we can take on the topic “12 Top Popular Candlestick Patterns Used in Technical Analysis “.
Thanks For Reading
Common Cryptocurrency Scams on Mobile Devices
Ultimate Guide to Symmetric versus Asymmetric Encryption
How Blockchain Is Used in The Internet of Things (IoT)
Ultimate Guide to Understanding What Makes a Blockchain Secure
Upto Date Blockchain Use Cases
Initial Coin Offering List – Comprehensive List of Projects Currently Doing ICO
Ultimate Guide to Initial Coin Offering (ICO)
Ultimate Guide to Understanding What Fractional Reserve is
Understanding Why Public WiFi Is Insecure
The Ultimate History of Cryptography
Understanding what DoS Attack is
Ultimate Guide to what Fiat Currency is
Ultimate Guide to zk-SNARKs and zk-STARKs
Things to Avoid When Using Binance Chain
How Blockchain Is Used In Charity
How Blockchain is Used in Supply Chain
Ultimate Guide to What a Replay Attack is
Ultimate Guide to Delegated Proof of Stake
Ultimate Guide to what Ransomware is
Ultimate Guide to understanding Cryptojacking
Ultimate Guide to Understanding Inflation for Beginners
How to Know Cryptocurrencies Pyramid and Ponzi Schemes
Ultimate Beginner’s Guide to Bitcoin’s Lightning Network
Advantages and Disadvantages Of Blockchain
Ultimate Guide to Ethereum Plasma




Leave a Reply