The Ultimate Guide to the Parabolic SAR Indicator
Table of Interests
Looking for the best article to read on Parabolic SAR?, then “The Ultimate Guide to the Parabolic SAR Indicator ”.is for you.
Technical analyst J. Welles Wilder Jr. developed the Parabolic Stop and Reverse (SAR) indicator in the late 1970s. It was presented in his book New Concepts in Technical Trading Systems, along with other popular indicators, such as the Relative Strength Index (RSI).
In fact, Wilder called this approach the Parabolic Time/Price System, while the concept of SAR was presented as follows:
SAR stands for Stop and Reverse. This is the point at which a Long trade is exited and a Short trade is entered, or vice versa.
– Wilder, J. W., Jr. (1978). New Concepts in Technical Trading Systems (p. 8).
Today, the system is commonly referred to as the Parabolic SAR indicator, which is used as a tool for identifying market trends and potential points of reversal. Although Wilder developed numerous technical analysis (TA) indicators manually, they are now part of most digital trading systems and charting software. As such, the techniques no longer require manual calculations and are relatively simple to use.
How does it work?
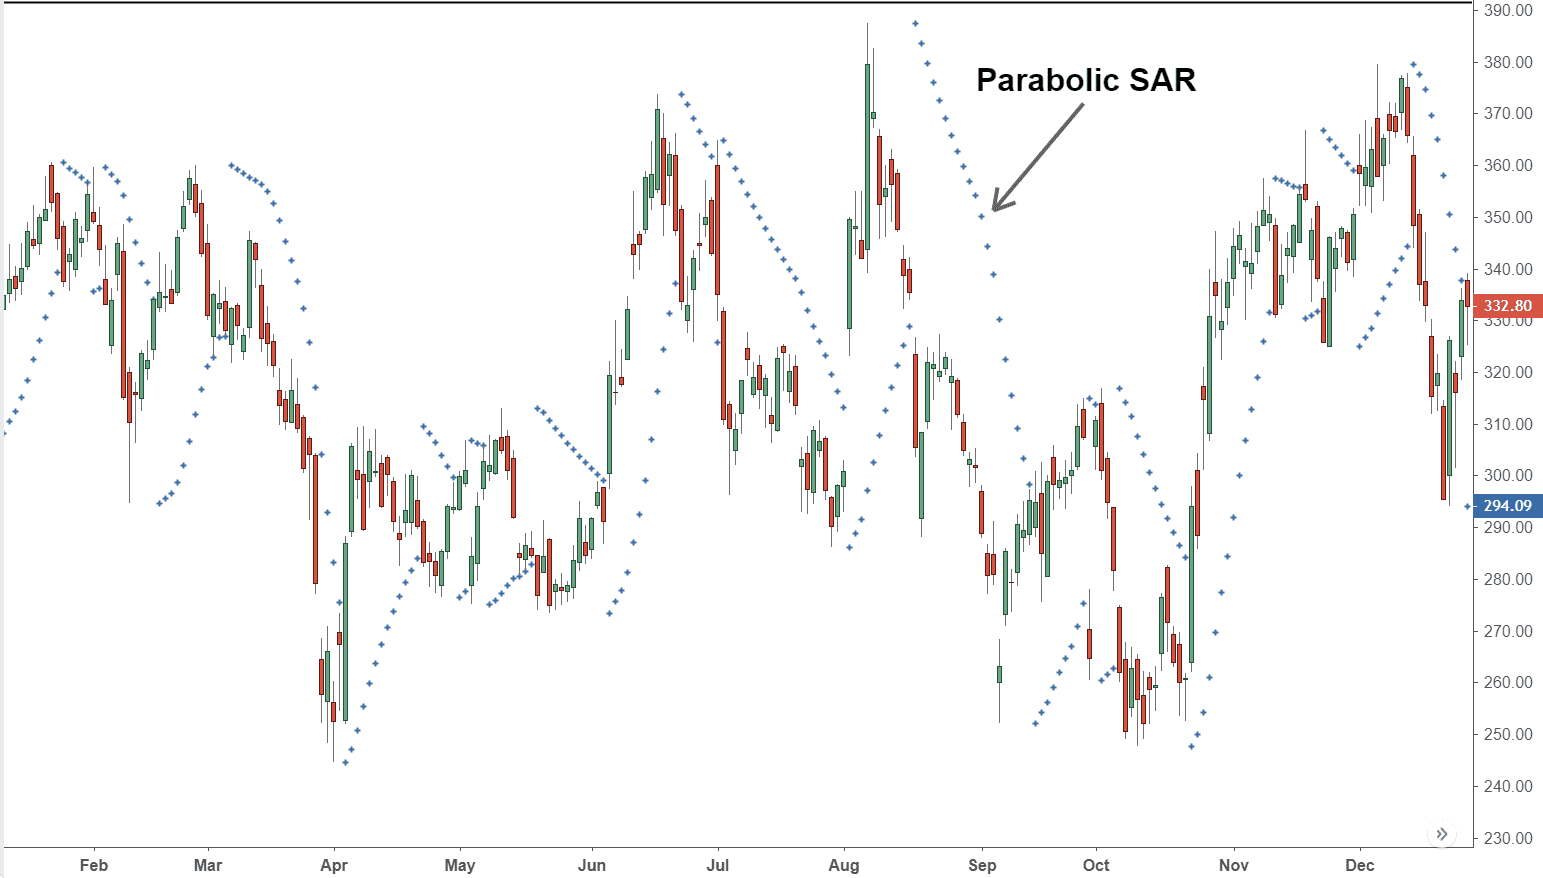
The Parabolic SAR indicator consists of small dots that are placed either above or below the market price. The disposal of the dots creates a parabola, but each dot represents a single SAR value.
In short, the dots are plotted below the price during an uptrend, and above it during a downtrend. They are also plotted during periods of consolidation, where the market moves sideways. But in this case, the dots will change from one side to another much more frequently. In other words, the Parabolic SAR indicator is less useful during non-trending markets.
Benefits
The Parabolic SAR can provide insights into the direction and duration of market trends, as well as potential points of reversal. As such, it may increase the chances of investors finding good buying and selling opportunities.
Some traders also use the Parabolic SAR indicator to determine dynamic stop-loss prices, so that their stops move along with the market trend. Such a technique is often referred to as trailing stop-loss.
Essentially, it allows traders to lock profits that were already made because their positions are closed as soon as the trend reverses. In some situations, it may also prevent traders from closing profitable positions or entering a trade too early.
Limitations
As mentioned, the Parabolic SAR is particularly useful in trending markets, but not so much during periods of consolidation. When there is a lack of a clear trend, the indicator is more likely to provide false signals, which may cause significant losses.
A choppy market (that moves up and down too quick) may also provide numerous misleading signals. So, the Parabolic SAR indicator tends to work best when prices change at a more gradual pace.
Another thing to consider is the sensitivity of the indicator, which can be adjusted manually. The higher the sensitivity, the higher the chances of false signals occurring.
In some cases, false signals can encourage traders to close winning positions too early, selling assets that still have earning potential. Even worse, fake breakouts can give investors a false sense of optimism, inducing them into buying too soon.
Lastly, because the indicator doesn’t consider the trading volume, it doesn’t give much information about the strength of a trend. Although big market movements cause the gap between each dot to widen, that should not be taken as indicative of a strong trend.
No matter how much information traders and investors have, risks will always be part of financial markets. But, many of them combine the Parabolic SAR with other strategies or indicators as a way to minimize risks and offset limitations.
Wilder recommended using the Average Directional Index along with the Parabolic SAR to gauge the strength of trends. In addition, moving averages, or the RSI indicator can also be included in the analysis before entering a position.
The Parabolic SAR calculation
Today, computer programs perform the calculations automatically. But for the ones interested, this section gives a brief explanation of the Parabolic SAR calculation.
The SAR points are calculated based on existing market data. So, to calculate today’s SAR, we use yesterday’s SAR, and to calculate tomorrow’s value, we use today’s SAR.
During an uptrend, the SAR value is calculated based on the previous highs. During downtrends, the previous lows are considered instead. Wilder referred to the highest and lowest points in a trend as Extreme Points (EP). However, the equation is not the same for uptrends and downtrends.
For uptrends:
SAR = Prior SAR + AF x (Prior EP – Prior SAR)
For downtrends:
SAR = Prior SAR – AF x (Prior SAR – Prior EP)
AF stands for the acceleration factor. It starts at 0.02 and increases by 0.02 whenever the price makes a new high (for uptrends) or a new low (for downtrends). However, if the limit of 0.20 is reached, this value is maintained by the duration of that trade (until the trend reverses).
In practice, some chartists manually adjust the AF to change the indicator’s sensitivity. An AF higher than 0.2 will result in increased sensitive (more reversal signals). An AF lower than 0.2 does the opposite. Still, Wilder stated in his book that 0.02 increases worked best overall.
While the calculation is relatively simple to use, some traders asked Wilder how to calculate the first SAR, considering that the equation requires the previous values. According to him, the first SAR can be calculated based on the last EP before a market trend reversal.
Wilder recommended traders to go back in their chart to find a clear reversal, and then use that EP as the first SAR value. The following SAR could then be calculated until the last market prices are reached.
For instance, if the market is trending up, a trader could go back a couple of days or weeks until they find a previous correction. Next, they find the local bottom (EP) for that correction, which could then be used as the first SAR for the following uptrend.
Closing Thoughts
Although it dates back to the 1970s, the Parabolic SAR is still widely used today. Investors can apply it to many of today’s investment alternatives, including Forex, commodities, stock, and cryptocurrency markets.
But no market analytics tool can guarantee 100% accuracy. So, before using Parabolic SAR or any other strategy, investors should make sure they have a good understanding of financial markets and technical analysis. They should also have proper trading and risk management strategies to mitigate the inevitable risks.
That’s the much we can take on the topic “The Ultimate Guide to the Parabolic SAR Indicator“.
Thanks For Reading
Common Cryptocurrency Scams on Mobile Devices
Ultimate Guide to Symmetric versus Asymmetric Encryption
How Blockchain Is Used in The Internet of Things (IoT)
Ultimate Guide to Understanding What Makes a Blockchain Secure
Upto Date Blockchain Use Cases
Initial Coin Offering List – Comprehensive List of Projects Currently Doing ICO
Ultimate Guide to Initial Coin Offering (ICO)
Ultimate Guide to Understanding What Fractional Reserve is
Understanding Why Public WiFi Is Insecure
The Ultimate History of Cryptography
Understanding what DoS Attack is
Ultimate Guide to what Fiat Currency is
Ultimate Guide to zk-SNARKs and zk-STARKs
Things to Avoid When Using Binance Chain
How Blockchain Is Used In Charity
How Blockchain is Used in Supply Chain
Ultimate Guide to What a Replay Attack is
Ultimate Guide to Delegated Proof of Stake
Ultimate Guide to what Ransomware is
Ultimate Guide to understanding Cryptojacking
Ultimate Guide to Understanding Inflation for Beginners
How to Know Cryptocurrencies Pyramid and Ponzi Schemes
Ultimate Beginner’s Guide to Bitcoin’s Lightning Network
Advantages and Disadvantages Of Blockchain
Ultimate Guide to Ethereum Plasma
Leave a Reply